Statistics Calculator
Paste a list of numbers to get the mean, median, mode, standard deviation, variance, standard error, coefficient of variation and quartiles.
Recent
Your last 10 settings, saved only in this browser. Nothing is uploaded.
Next step
Once you have the mean and quartiles, plot the same numbers to see the spread.
Draws bar charts, histograms, box plots, scatter, dot, stem and leaf plots and radar charts, and exports PNG or SVG.
Plot these numbers →Popular tools
- P-Value CalculatorEnter a z, t, chi-square or F statistic and the degrees of freedom to get the p-value, the critical value and whether the result is significant.
- Binomial Distribution CalculatorEnter n, p and x to get any binomial probability — exactly, at most, at least or between — with the table and chart.
New and updated tools
- Growth Rate Formula CalculatorEnter a start value and an end value to get the growth rate, or work out the end value, start value or number of periods, with the working shown.
- F Table (F Distribution Critical Values)Enter the numerator and denominator degrees of freedom and α to get the F critical value, with the full F table for that α underneath.
- Stanine CalculatorEnter a raw score with the mean and SD, a z-score, a percentile or a list of scores to get the stanine, its meaning and the percentile.
- Scatter Plot MakerPaste your x and y values to draw a scatter plot with an optional trend line, the correlation coefficient and the equation, then download the chart.
- Sum of Squares CalculatorPaste a list of numbers to get the sum of squared deviations from the mean, the raw sum of squares or the sum about a value you pick, with the working.
- T Table (Student t Critical Values)Enter your degrees of freedom and significance level to get the t critical value, with the full t table for df 1 to 120 and ∞ underneath.
At a glance
Statistics Calculator is a free browser calculator that takes a pasted list of numbers and returns its count, sum, mean, median, mode, range, standard deviation, variance, standard error, coefficient of variation and quartiles.
- It accepts up to 50,000 values and shows each formula with your numbers substituted.
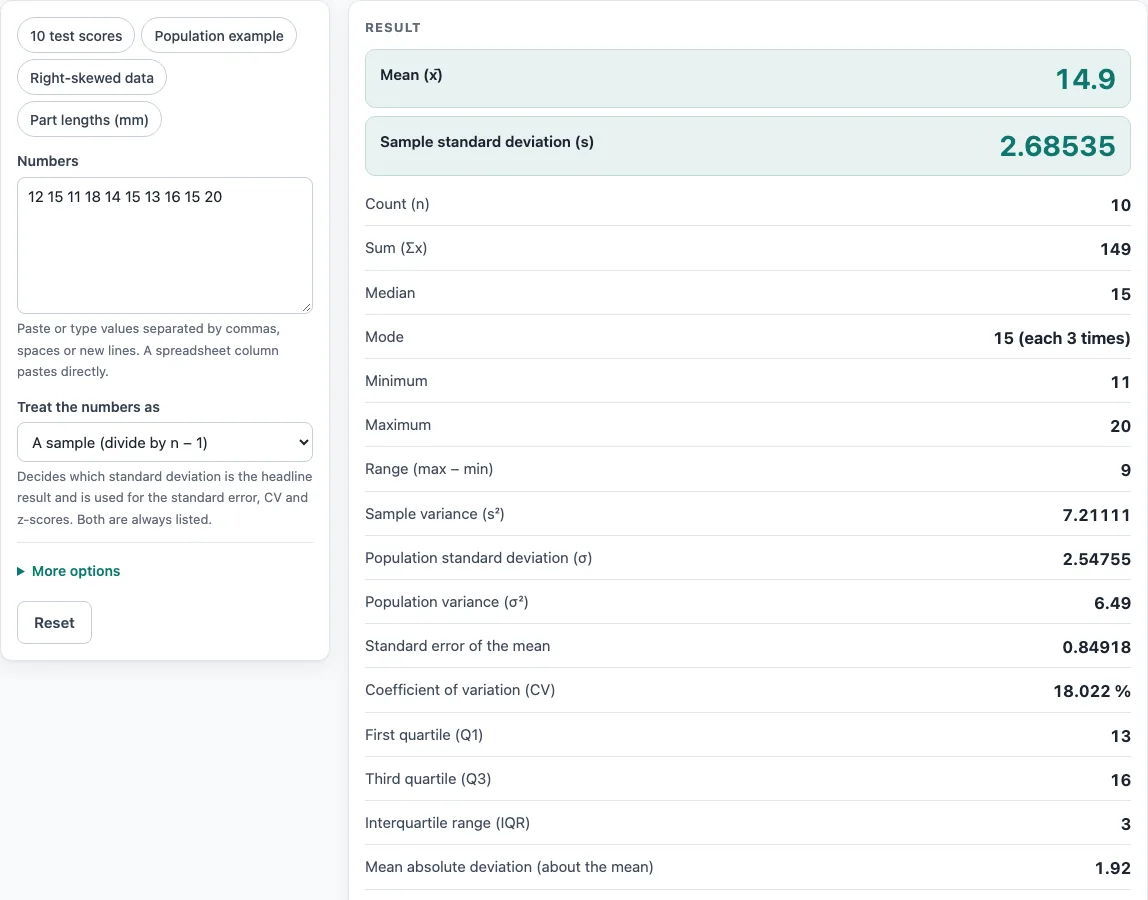
- For the data 12, 15, 11, 18, 14, 15, 13, 16, 15, 20 the sample standard deviation is 2.6854 and the population standard deviation is 2.5475.
- For 2, 4, 4, 4, 5, 5, 7, 9 treated as a population, the mean is 5 and the standard deviation is exactly 2.
- The median absolute deviation is also shown multiplied by 1.4826, which estimates sigma for normally distributed data.
- Warnings appear for a single value, identical values, fewer than 8 values, and a coefficient of variation with negative data.
Sources: NIST/SEMATECH e-Handbook of Statistical Methods: Measures of Location (checked 2026-10-15) · Standard deviation (Wikipedia) (checked 2026-10-15) · Median absolute deviation (Wikipedia) (checked 2026-10-15)
How to use the Statistics calculator
- Click into the number box and type or paste your values. Separate them with commas, spaces, semicolons or new lines.
- Read the summary: count, sum, mean, median, mode(s), minimum, maximum and range.
- Find the standard deviation and variance. Both the sample and population versions are listed; under “Treat the numbers as”, choose a sample or the whole population for the headline result.
- Check the coefficient of variation, the standard error and the two absolute deviations, which are labelled separately.
- Look at the table of sorted values (position, rank, z-score) and the dot plot of mean, median and ±1 standard deviation.
- Read any warning. Warnings appear for a single value, identical values, fewer than 8 values, and a coefficient of variation with negative data.
- Open “How it was calculated” under the result to see the formula, the values substituted and the answer with units.
- Open “More options” for the less common inputs. Choose a quartile method there if you need Q1, Q3 and the IQR calculated another way.
To start from a worked case, press a preset button above the form. Press “Reset” to return to the starting example. “Copy result” copies the result lines with a link. “Copy link” copies the page address, which stores every input in the ?s= part of the URL, so the same calculation reopens later or can be sent to a colleague. “Print / save as PDF” produces a one-page record with the inputs, results, calculation steps and date.
What is a statistics calculator and what does it give me?
A statistics calculator reads a list of numbers and summarises it with standard measures. It tells you how many values there are, where the centre lies, how spread out they are, and how precisely the mean is estimated.
The sum of squared deviations, Σ(x − x̄)², and the raw sum of squares, Σx², are both given. The first feeds the standard deviation, and the second is used in some textbook formulas.
How do I find the mean, median and mode of a data set?
Add all the values and divide by n to get the mean. Sort the values and take the middle one as the median. If n is even, the median is the average of the two middle values. The mode is the value that appears most often.
Take the data 12, 15, 11, 18, 14, 15, 13, 16, 15, 20. The sum is 149, so the mean is 149 ÷ 10 = 14.9. Sorted, the values are 11, 12, 13, 14, 15, 15, 15, 16, 18, 20. The two middle values are both 15, so the median is 15. The value 15 appears three times, so the mode is 15. A data set can have more than one mode, and the calculator lists all of them. The range is 20 − 11 = 9.
How do I calculate standard deviation from a list of numbers (sample or population)?
Standard deviation measures the typical distance of values from the mean. Square the differences from the mean, average them, then take the square root. Use n − 1 for a sample and n for a population.
- Find the mean.
- Subtract the mean from each value and square the result.
- Add the squared differences.
- Divide by n − 1 (sample) or n (population).
- Take the square root.
Use the sample version when your numbers are a subset of a larger group. Use the population version when the list is the whole group. For the example above, the sample standard deviation is 2.6854 and the population standard deviation is 2.5475. For 2, 4, 4, 4, 5, 5, 7, 9 treated as a population, the mean is 5 and the standard deviation is exactly 2.
How do I calculate the coefficient of variation?
The coefficient of variation (CV) is the standard deviation divided by the absolute mean, multiplied by 100 percent. It expresses spread relative to the size of the values, so you can compare variability between data sets with different units or scales.
For the example above, using the sample standard deviation, the CV is 2.6854 ÷ 14.9 × 100 = 18.02 %. For the population of 2, 4, 4, 4, 5, 5, 7, 9, the CV is 2 ÷ 5 × 100 = 40 %. The CV becomes hard to interpret when the data contain negative values, which is why the calculator warns you in that case.
What is the standard error of the mean and how is it calculated?
The standard error of the mean (SE) is the standard deviation divided by the square root of n. It estimates how much the sample mean would vary from sample to sample, so it describes the precision of the mean rather than the spread of the data.
For the example, SE = 2.6854 ÷ √10 = 0.84918. To turn a standard error into a range of plausible values for the mean, use the confidence interval calculator.
Which MAD does this calculator use — mean absolute deviation or median absolute deviation?
It gives both, and labels them separately. The mean absolute deviation is the average of the absolute differences from the mean. The median absolute deviation is the median of the absolute differences from the median.
For the example, the mean absolute deviation is 1.92 and the median absolute deviation is 1.5. The median absolute deviation is also shown multiplied by 1.4826, which makes it an estimate of σ for normally distributed data. Because it depends on the median, it is less affected by outliers than the mean-based version.
Sources
- NIST/SEMATECH e-Handbook: measures of location, measures of scale (standard deviation, MAD), skewness and kurtosis and percentiles
- Adjusted skewness and excess kurtosis (G1, G2): Joanes and Gill (1998), matching common statistics software
- Quartile methods as defined in Wikipedia, Quartile
Worked examples
| Input | Result |
|---|---|
| 10 values from 11 to 20 | mean 14.9, standard deviation 2.685, median 15 |
| 8 values from 2 to 9 | mean 5, standard deviation 2, median 4.5 |
| 12 values from 64 to 95 | mean 83.33, standard deviation 9.461, median 86.5 |
| 10 values from 10.1 to 10.5 | mean 10.29, standard deviation 0.1197, median 10.3 |
| 15 values from 1 to 9 | mean 5.133, standard deviation 2.825, median 5 |
Calculated by the tool above with these values.
Frequently asked questions
Can I use the results in commercial projects or client reports?
Yes. Results may be used in any work, including commercial reports, theses and client projects, without attribution.
Is the calculator free, and is anything I type uploaded?
The calculator is free and has no account or sign-up. Everything is calculated in your browser, and nothing you type is uploaded.
Can I print or share a calculation?
Yes. “Print / save as PDF” produces a one-page record with the inputs, results, calculation steps and date. “Copy link” stores every input in the URL, so anyone with the link can reopen the same calculation.
Why does the calculator show two standard deviations?
It shows the sample and population versions every time, because they answer different questions. A setting chooses which one is the headline result. Use the sample version when your data is a sample from a larger group.
What does the warning about fewer than 8 values mean?
With very few values, the skewness and kurtosis estimates and the quartiles are unstable, so the calculator warns you. The basic results like the mean and standard deviation are still correct for the numbers you entered.
Why does the calculator warn about a coefficient of variation with negative data?
The CV divides by the absolute mean, so it can give a misleading picture when values are negative or the mean is close to zero. Check whether a relative measure is meaningful for your data before you use it.
Will the quartiles match the box plot calculator?
Yes. Both tools use the same quartile method, so they give identical Q1 and Q3 for the same numbers, provided you choose the same method.
Related tools
- Standard deviation calculator — sample and population SD with every step
- Mean, median and mode calculator — the centre of a data set and its range
- Box and whisker plot calculator — quartiles, IQR, fences and outliers
- Percentile calculator — any percentile or the rank of a value
- Relative standard deviation calculator — the SD as a percentage of the mean
- Confidence interval calculator — a range for a mean, a proportion or a difference
- Correlation coefficient calculator — Pearson r with p-value and CI
- Spearman rank correlation calculator —
- Linear regression calculator — the least squares line and R²